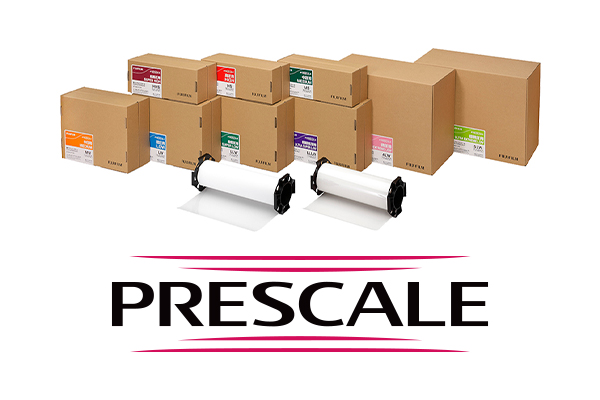
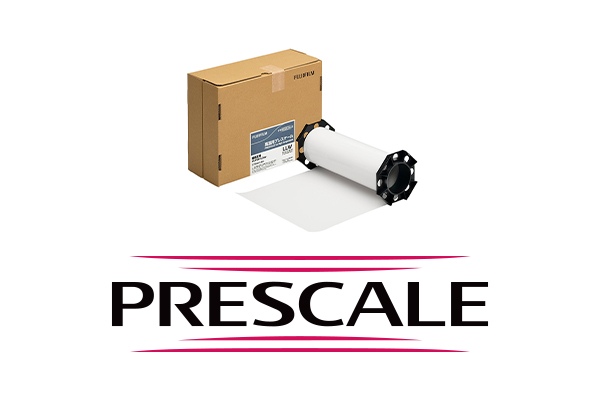
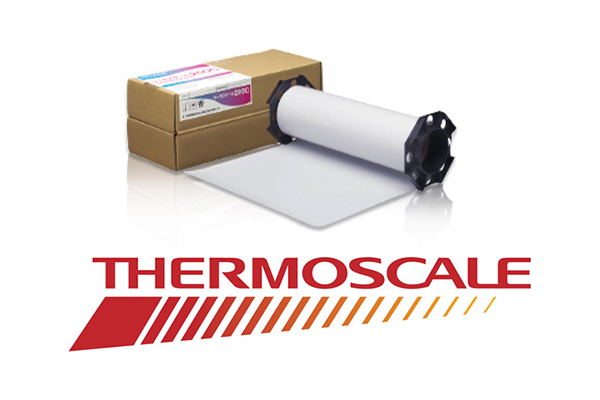
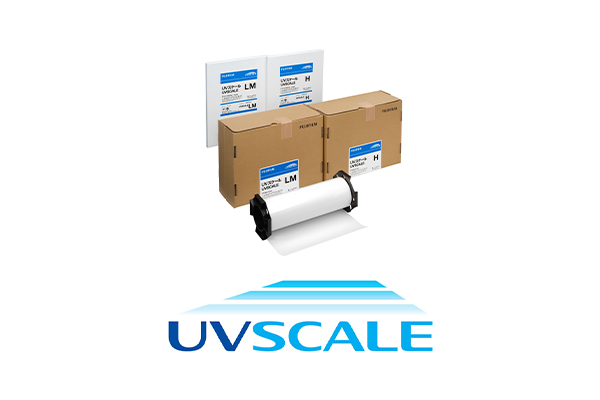
FPD-8010E provides a wide range of effective presentation and report functions utilizing FPD-8010E software and a scanner to digitize Prescale outputs to allow the user to produce multi-faceted measurement data such as pressure distribution and enlargement, cross-sectional distribution, and 3-D image display.
This serves to accelerate product development and improved yields based on detailed multi-faceted measurement data and analysis.
Dedicated Software
Converts Prescale density values into pressure values.
Dedicated Cover
This manuscript hold-down scanner cover improves date-read precision.
Calibration Sheet
The calibration sheet limits scanner-read errors to a fixed range.
Various data such as average pressure and maximum pressure are displayed.*1
The specified field is enlarged. (X 4, X 8, X 16)
Pressure distribution on a line passing through a specified point is shown on a line graph.
Pressure is displayed in 3-D format.*2
The upper and left segments of the total pressure are displayed on a bar graph.
Pressure on the circumference is displayed as a histogram.*2
Pressure data is exported to a text file.*2
Step-by-step pressure values are displayed in animated format.
- *1 The scope of for Ultra Extreme Low Pressure(5LW) that can be measured by pressure image analysis system FPD-8010E is 0.015MPa to 0.050MPa.
- *2 Ultra Extreme Low Pressure(5LW) is not supported.

1)Prepare the colored Prescale.

2)Scan Prescale Samples (Scanner purchased separately by user)

3)Perform analysis utilizing FPD-8010E Software.


